Python Program to Plot Cardioid Curve
This Python example plots a polar curve to produce Cardioid curve using numpy and matplotlib.
In mathematics, Cardioid Curve has general form r = a ± bcos(θ) or r = a ± b sin(θ) with a/b = 1.
For example, Polar curve r = 4 + 4 * sin(θ), r = 1 + 1 * cos(θ), r = 2 - 2 * cos(θ) & r = 5 - 5 * sin(θ) all produces Cardioid curve.
Python Source Code: Cardioid Curve (Polar Plot)
# Python program to Polar plot Cardioid Curve
import numpy as np
from matplotlib import pyplot as plt
theta = np.linspace(0, 2*np.pi, 1000)
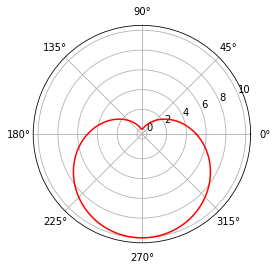
r = 5 - 5 * np.sin(theta)
plt.polar(theta, r, 'r')
plt.show()
Output