Python Program to Plot Cos Function Using Numpy & Matplotlib
This Python program plots Cos (Co-sinusoidal) wave using numpy and matplotlib library.
Python Source Code: Cos Wave
# Importing Required Libraries
import numpy as np
import matplotlib.pyplot as plt
# Generating time data using arange function from numpy
time = np.arange(-3*np.pi, 3*np.pi, 0.01)
# Finding amplitude at each time
amplitude = np.cos(time)
# Plotting time vs amplitude using plot function from pyplot
plt.plot(time, amplitude)
# Settng title for the plot in blue color
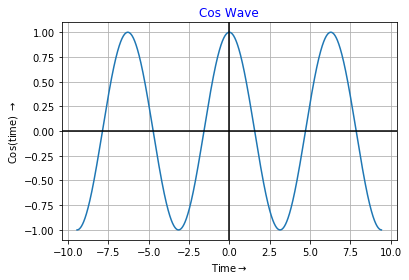
plt.title('Cos Wave', color='b')
# Setting x axis label for the plot
plt.xlabel('Time'+ r'$\rightarrow$')
# Setting y axis label for the plot
plt.ylabel('Cos(time) '+ r'$\rightarrow$')
# Showing grid
plt.grid()
# Highlighting axis at x=0 and y=0
plt.axhline(y=0, color='k')
plt.axvline(x=0, color='k')
# Finally displaying the plot
plt.show()
Cos Wave Output