Python Program to Plot Sinc Function
In mathematics, unnormalized sinc function is given as sin(x)/x and normalized sinc function is given as sin(πx)/πx. The name sinc is abbreviated form of Sine Cardinal or Sinus Cardinalis
The sinc function is used in various signal processing applications like anti-aliasing, resampling filter, and in interpolation.
This python program plots normalized sinc function using numpy and matplotlib.
Python Source Code: Sinc Function
# Importing Required Libraries
import numpy as np
from matplotlib import pyplot as plt
# Generating time data using arange function from numpy
time = np.arange(-2*np.pi, 2*np.pi, 0.01)
# Finding amplitude at each time using np.sinc function
amplitude = np.sinc(time)
# Plotting time vs amplitude using plot function from pyplot
plt.plot(time, amplitude)
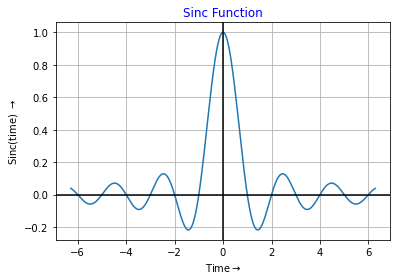
# Settng title for the plot in blue color
plt.title('Sinc Function', color='b')
# Setting x axis label for the plot
plt.xlabel('Time'+ r'$\rightarrow$')
# Setting y axis label for the plot
plt.ylabel('Sinc(time) '+ r'$\rightarrow$')
# Showing grid
plt.grid()
# Highlighting axis at x=0 and y=0
plt.axhline(y=0, color='k')
plt.axvline(x=0, color='k')
# Finally displaying the plot
plt.show()
Output