Python Program to Plot Heart Shape Using Numpy & Matplotlib
This Python programming example plots a perfect heart like shape using Numpy and Matplotlib Library.
In this program, we use numpy to generate data for theta, x and y co-ordinates and pyplot from matplotlib is used to plot data.
This example uses following formula to generate heart shape x and y co-ordinates:
x = 16 * sin3(θ)
y = 13 * cos(θ) - 5 * cos(2θ) - 2*cos(3θ) - cos(4θ)
y = 13 * cos(θ) - 5 * cos(2θ) - 2*cos(3θ) - cos(4θ)
Python Source Code: Heart Shape Plot
# Python program to Plot Perfect Heart Shape
# importing libraries
import numpy as np
from matplotlib import pyplot as plt
# Creating equally spaced 100 data in range 0 to 2*pi
theta = np.linspace(0, 2 * np.pi, 100)
# Generating x and y data
x = 16 * ( np.sin(theta) ** 3 )
y = 13 * np.cos(theta) - 5* np.cos(2*theta) - 2 * np.cos(3*theta) - np.cos(4*theta)
# Plotting
plt.plot(x, y)
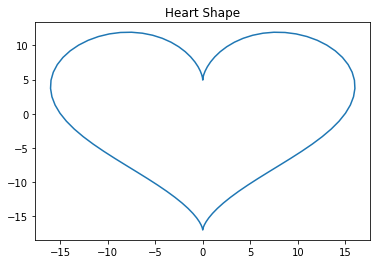
plt.title('Heart Shape')
plt.show()
Output